Silver Dollars & Trade Dollars of the United States - A Complete Encyclopedia
Q. David Bowers
The 1801, 1802, and 1803 coins had a 17% higher than average survival rate due to their young age.
To summarize the percentage above or below average for a particular coin's chances for survival: 1795: -17% = 83% of average
1796: -17% = 83% of average
1797 -17% = 83% of average
1798: 0% = average
1799: 0%"= average
1800: 0% = average
1801: +17% = 117% of average
1802: +17% = 117% of average
1803: +17%. = 117% of average
Using the preceding numbers, I smooth out the percentages to create a continuum, with 1799, or the middle year,
being 0%: ".
1795: -20.4% '" 79.6% of average
1796: -15.3% = 84.7% of average
1797: -10.2% = 89.8% of average
1798: -5.1% = 94.9% of average
1799: 0% '" average"
1800: +5.1% = 105.1% of average
1801: +10.2% = 110.2% of average
1802: +15.3% = 115.3% of average
1803: +20.4% = 120.4% of average
The next step is to factor the preceding numbers into the theoretical mintage figures obtained by averaging the Economite and certification data. For example, the figure for 1795 is 322,886. If this represents 79.65% of average, then 79.65 divided into 322,886 yields a weighted estimated original mintage for 1795-dated dollars of 405,381 coins.
1795: Weighted estimated original mintage: 405,381 1796: 77,874
1797: 62,958
1798: 244,132
1799: 409,499
1800: 102,737
1801-2-3 as a group: 185,154 Total of preceding: 1,487,735
Government mintage total for the same period: 1,438,566, less 1,758 for 1794 not included in above figures, or 1,436,808.
To reconcile the small difference, as the weighted estimated original mintage is 3.54% higher than the government figures (due to the uneven distribution of the original mintage figures vs. the even distribution of the survival percentages), divide the weighted estimated original mintage figures by 103.54, and the resultant figures are as follows:
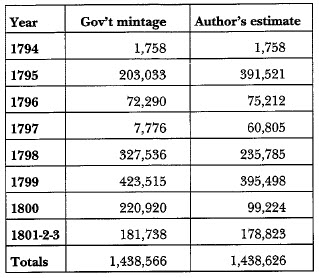
1795: 391,521 = author's estimated original mintage 1796: 75,212'" author's estimated original mintage 1797: 60,805 = author's estimated original mintage 1798: 235,785 = author's estimated original mintage 1799: 395,498 = author's estimated original mintage 1800: 99,224 = author's estimated original mintage 1801-2-3 as a group: 178,823 = author's estimated original mintage.
Total of preceding: 1,436,868
Government mintage figure for the same period: 1,436,808.
Here is a comparison of the government figures and my estimated original figures:
Author's Estimated Figures
Using the preceding estimated original figure of 178,823 for the years 1801, 1802, and 1803 combined, and realizing that there are no individual Economite Hoard data for these years, I revert to the certification data-not necessarily a valid move, as had Economite data existed, they would have acted as a buffer to the certification data, and helped minimize the effect of certification resubmissions. The certification data are given herewith.
1801: 81 coins certified = 21.5% of total
1802: 173 coins certified = 46.0% of total
1803 122 coins certified = 32.4% of total Total: 376 coins certified = 100% of total
Applying these percentages to the 178,823 total for 1801-2-3 yields these mintage figures:
1801: 38,447 = original mintage (unadjusted for survival ratio)
1802: 82,259 = original mintage (unadjusted for survival ratio)
1803: 57,939 = original mintage (unadjusted for survival ratio)
Total: 178,645
Earlier, I stated that 1801 dollars had a survival ratio in relation to their mintage of 110.2 % of the average survival ratio 1795-1803. The figures for the 1801, 1802, 1803 years are:
1801: survival ratio of 110.2% of the 1795-1803 average
1802: survival ratio of 115.3% of the 1795-1803 average
1803:: survival ratio of 120.4% of the 1795-1803 average
In other words, if the years 1801, 1802, and 1803 are considered alone, 1802 had a survival ratio 5.1% higher than 1801, and 1803 had a survival ratio 10.2% higher than 1801 and 5.1 % higher than 1802.
If the 1802 survivors form the center of the interpolated numbers for the survivors of 1801, 1802, and 1803, then the survival ratio of 1801 is 5.1% less and that of 1803 is 5.1 % greater. Thus: 1801 = 94.9% survival rate, 1802 = 100% survival rate, and 1803 = 105.1 % survival rate. Thus:
1801: 38,447 x 94.9% = 36,426 1802: 82,259 x 100.0% = 82,259 1803: 57,939 x 105.1 % = 60,894 Total: 176,729
The slight error of 179,579 adjusted mintages vs. 178,823 is due to 1801 having a smaller mintage than 1803; thus the survival rate multiplication more heavily weights 1803. To compensate for this, if each final figure is multiplied by .9958, the total will be correct:
1801: 36,426 x .9958 = 36,273 = author's estimated original mintage
1802: 82,259 x .9958 = 81,914 = author's estimated original mintage
180360,894 x .9958 = 60,638 = author's estimated original mintage
Total: 178,825
These figures are compared to the government mintage figures below: